Crop & land suitability
Where should this crop go?
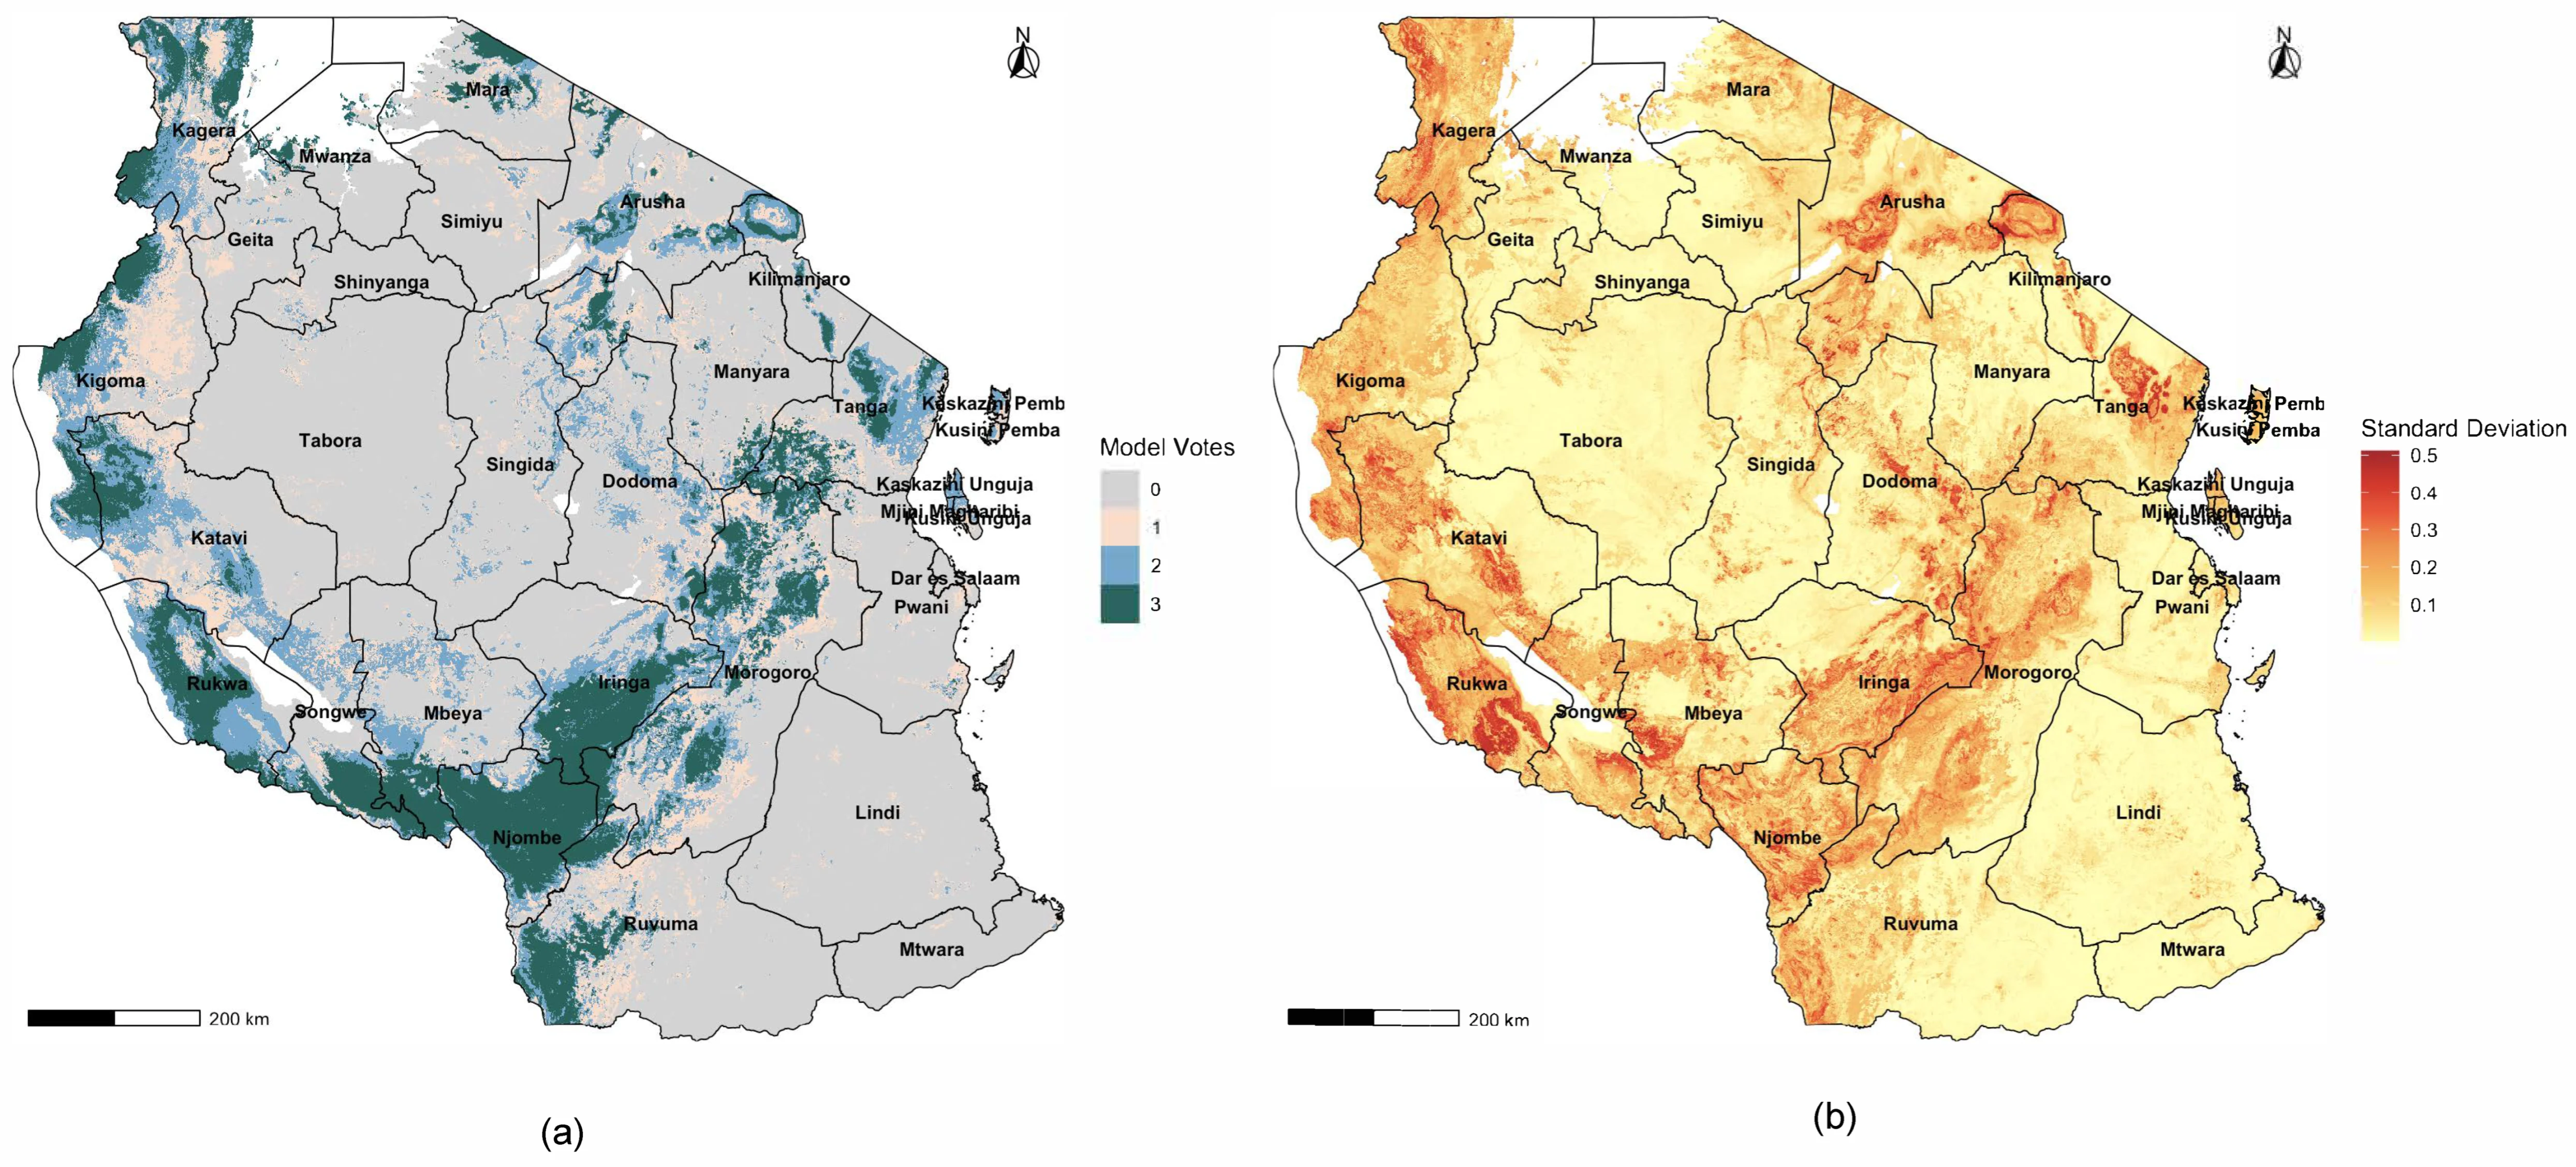
Suitability mapping for current conditions and future climate scenarios, species distribution models (MaxEnt, random forest, BRT, GAM), and subnational targeting for expansion into new growing regions.
e.g. avocado suitability across Tanzania, four ML models and an ensemble