Spatial data science for climate-resilient agriculture

I build spatial models for crop suitability, water resources, and climate risk.

Crop & land suitability Water resources Climate risk

I work with satellite imagery, climate records, and machine learning, and I translate that data into practical maps and spatial models for research institutes, development agencies, and agribusinesses. I have been at this for twelve years, across Latin America, Africa, and Australia, and most of the methods behind it have been through peer review.

Based in Morocco. Open to remote and international projects.

6
Peer-reviewed
publications
200+
Citations across
the record
12+
Years in
the field
3
Continents: Americas,
Africa, Oceania
Worked with CIAT / Alliance Bioversity Curtin University African Plant Nutrition Institute
Capabilities

Three questions I help teams answer

Most projects come down to one of these three questions. Whatever the answer looks like, you get the code and the workflow with it, so your own team can check the method and run it again.

Crop & land suitability

Where should this crop go?

Suitability mapping for current conditions and future climate scenarios, species distribution models (MaxEnt, random forest, BRT, GAM), and subnational targeting for expansion into new growing regions.

e.g.  avocado suitability across Tanzania, four ML models and an ensemble
Water resources & hydrology

Is there enough water?

Watershed delineation, water yield and ecosystem-service modelling (InVEST), drought monitoring, and rainfall-runoff analysis. My graduate training is in hydrometeorology, so this is home ground.

e.g.  water yield under climate change, Meta River basin, Colombia
Climate risk & vulnerability

Where does climate risk hit hardest?

Climate sensitivity and vulnerability assessments, adaptation prioritisation, and risk indices for agricultural and ecological systems, resolved down to district level.

e.g.  Espeletia vulnerability across 36 páramo complexes, RCP 8.5

Underneath all of it: reproducible spatial pipelines

Everything runs in R, Python, Google Earth Engine, and Quarto, so you can open it and see exactly how it works. When new data arrives, your team can rerun the whole pipeline without me.

Selected work

Three projects, in detail

One for each of the questions above. Each started as messy field data and ended up peer-reviewed and published.

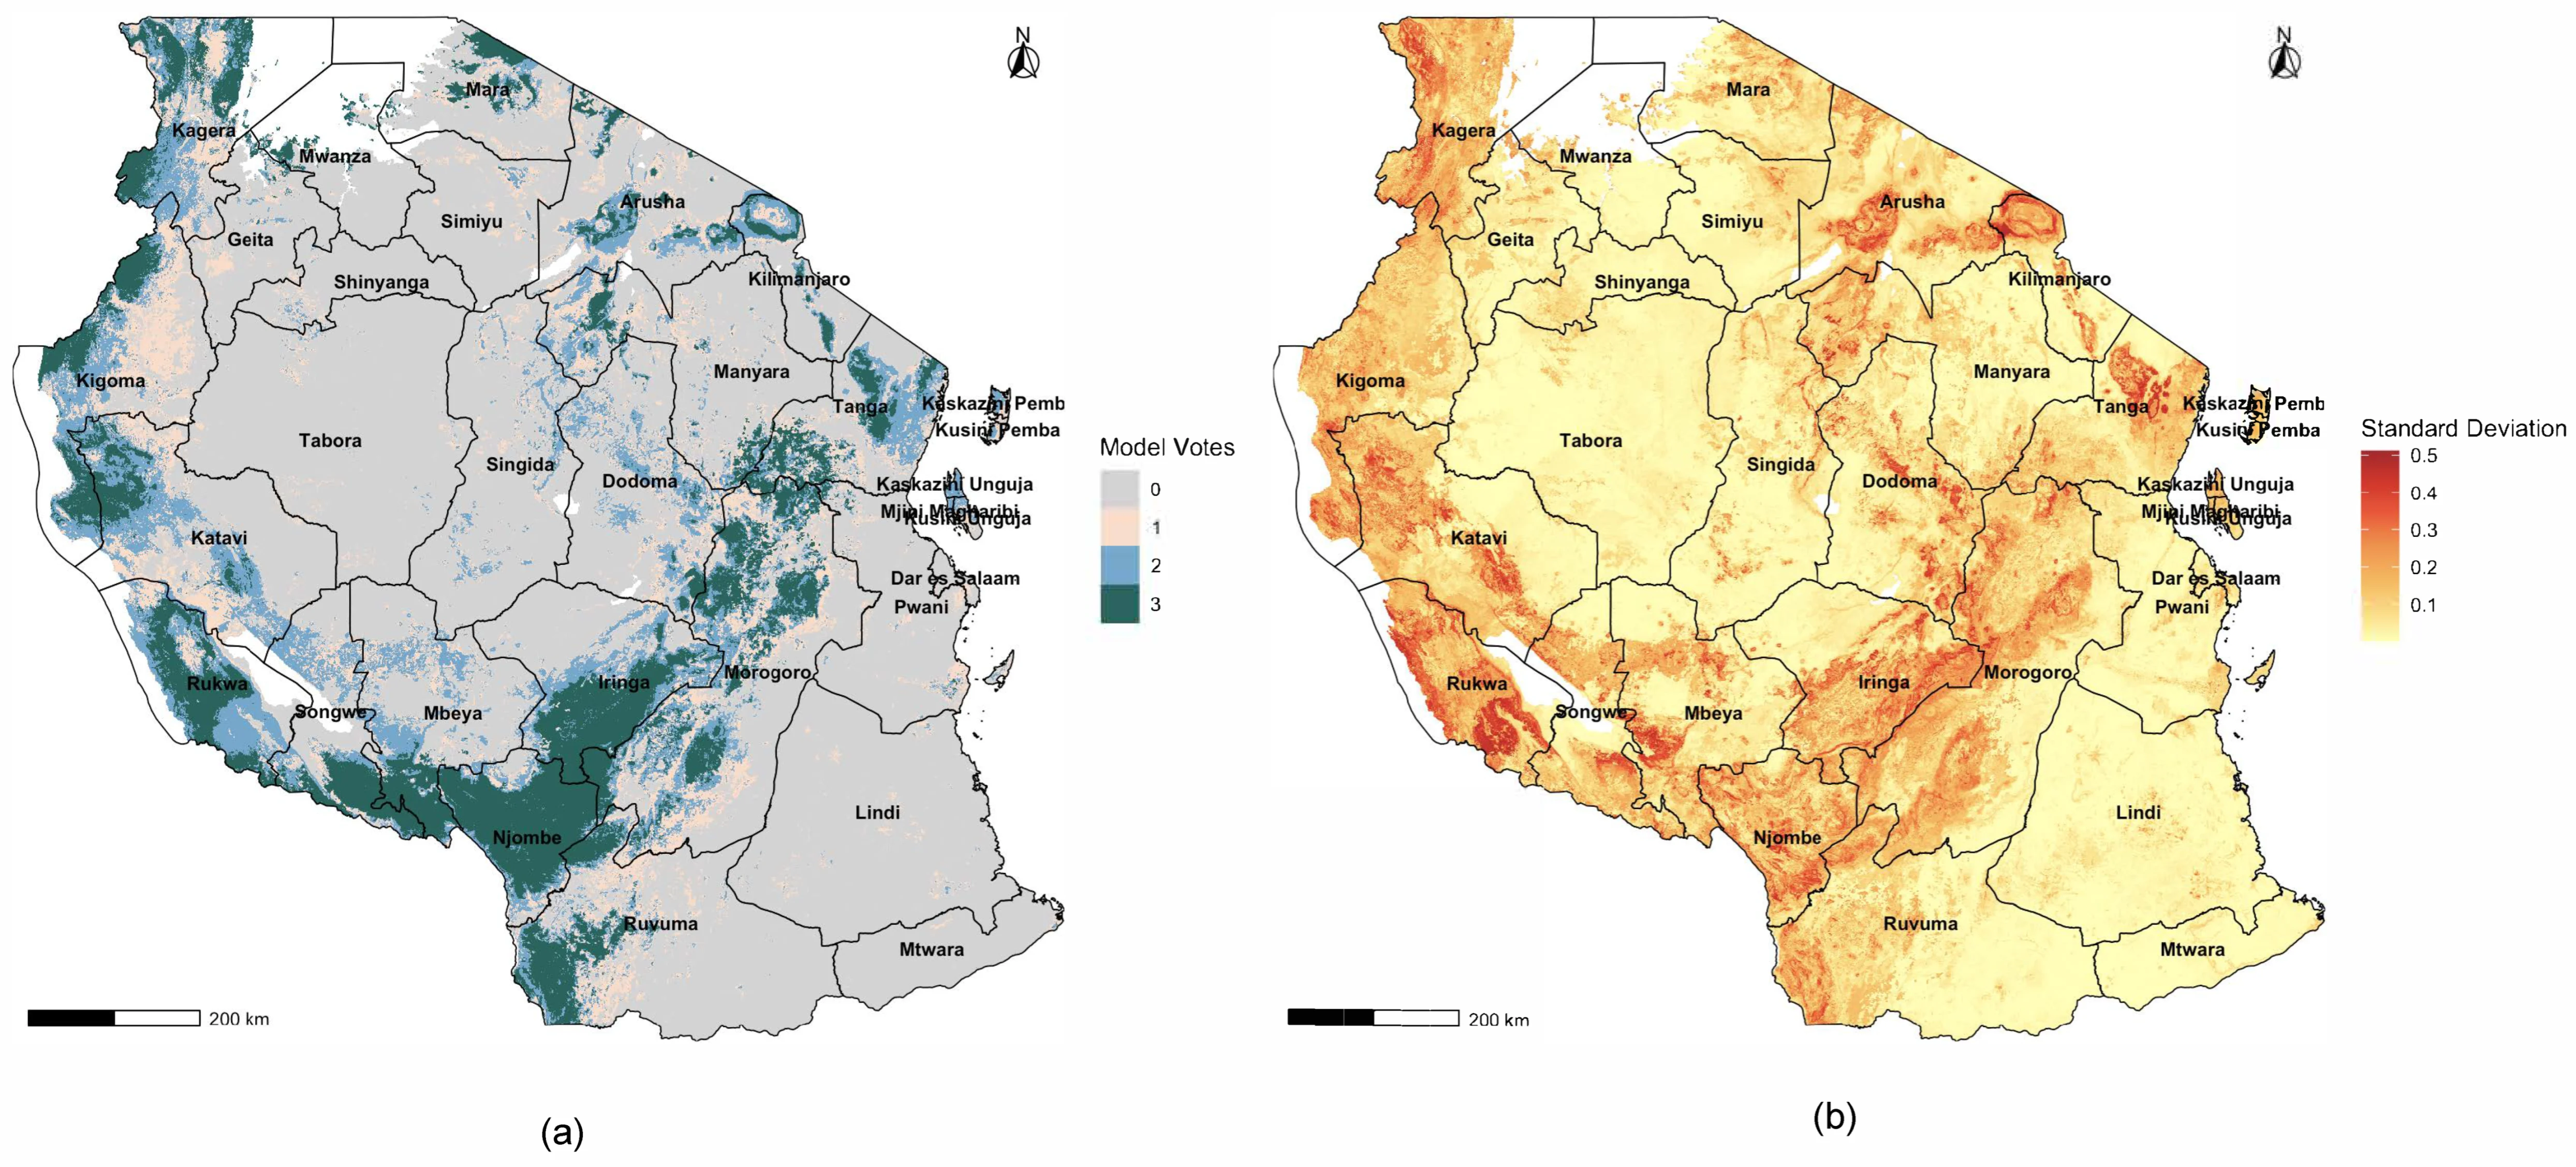
Two maps of Tanzania showing inter-model agreement and standard deviation for avocado suitability, from green consensus to dark red high uncertainty. Fig. Inter-model agreement (a) and uncertainty (b), avocado suitability, Tanzania
Crop suitability

Where should Tanzania plant avocado?

Tanzania's avocado exports are growing fast, but planting still runs on tradition rather than evidence. I modelled biophysical suitability across the country with four algorithms, calibrated on 199 GPS-tagged records, then built an ensemble that maps both where the models agree and where they do not.

  • 199 occurrence records across 11 regions
  • GAM, BRT, MaxEnt, random forest, plus ensemble
  • Spatial block cross-validation, random forest best at AUC 0.81
Published in Horticulturae, 2026 Read paper
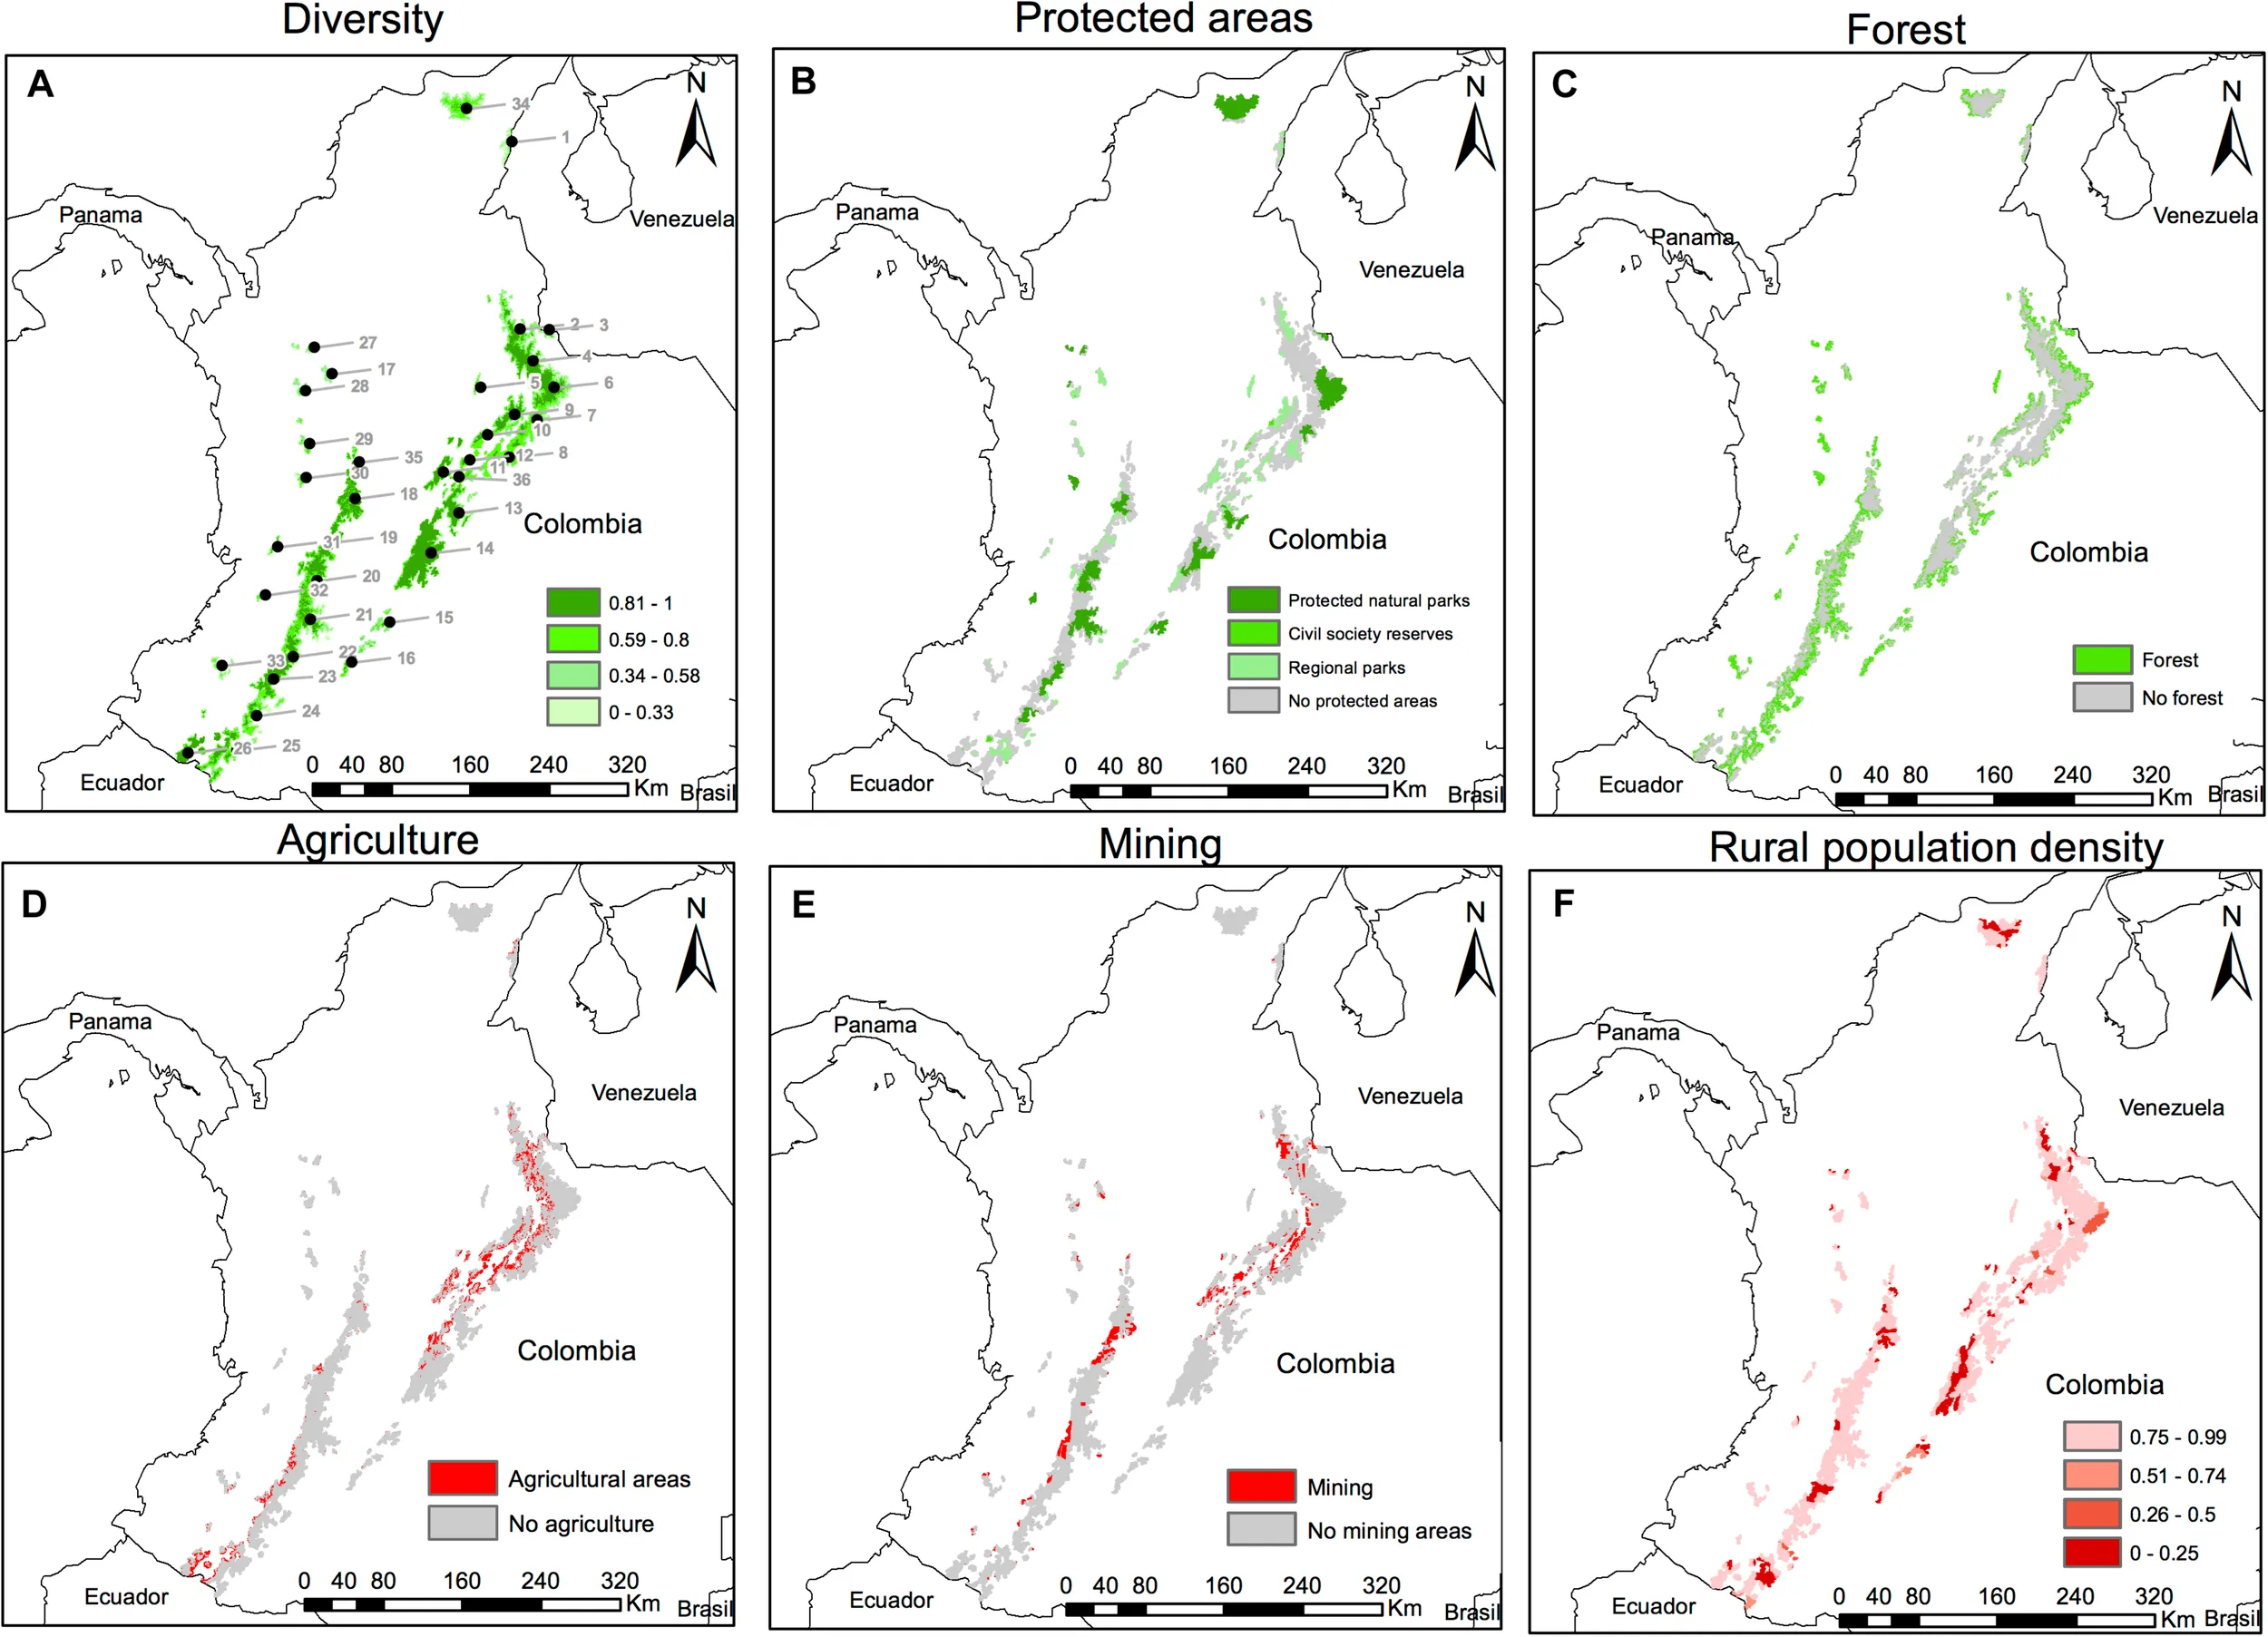
Map of Colombia locating páramo complexes, with panels showing Espeletia rosette plants studied in the climate vulnerability assessment. Fig. Espeletia distribution across Colombian páramo complexes
Climate vulnerability

Which páramos are most vulnerable to warming?

Páramos sit above the Andean treeline and feed water to millions of people downstream. They are also home to Espeletia, a genus that radiated into dozens of species unusually fast, which makes it a sensitive early indicator of climate stress. I modelled 28 taxa across 36 páramo complexes, pairing each complex's climate sensitivity with its capacity to adapt under RCP 8.5 to a 2050 horizon. The species-rich eastern complexes came out most exposed.

  • 28 taxa across 36 páramo complexes
  • Climate sensitivity coupled to adaptive-capacity index
  • RCP 8.5 projection to a 2050 horizon
Published in Frontiers in Ecology and Evolution, 2020 Read paper
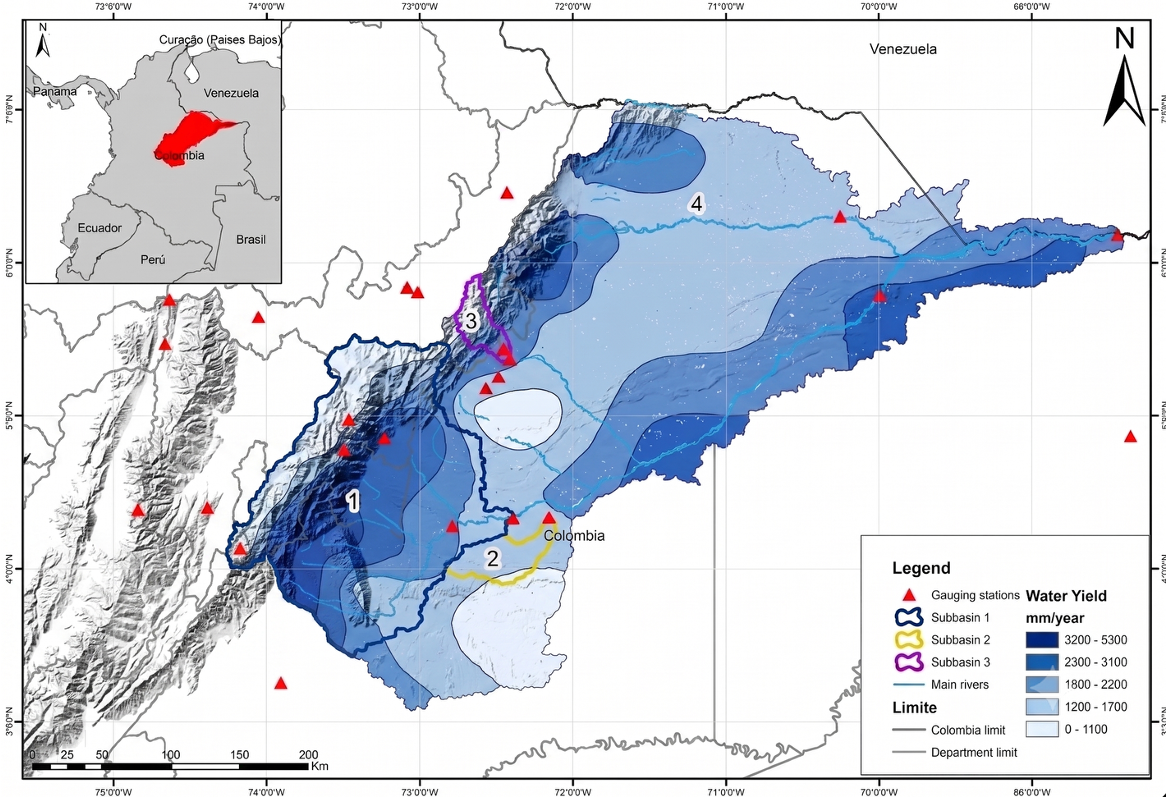
Map of the Meta River basin in Colombia showing modelled annual water yield in millimetres per year, from under 1,100 to over 3,200, with subbasins, gauging stations, and main rivers. Fig. Modelled annual water yield (mm/year), Meta River basin and subbasins, Colombia
Water resources

How will water yield shift in the Meta River basin?

The Meta drains a wide stretch of Colombia's eastern plains, and it made a fair test of whether a global ecosystem-service tool holds up on a tropical basin it was never tuned for. I ran the InVEST annual water yield model across the basin and its subbasins, checked the output against gauging-station records, then pushed it forward under a future climate scenario. Modelled yield spanned roughly 0 to 5,300 mm per year, highest along the Andean headwaters in the west and easing off across the plains to the east.

  • InVEST annual water yield model, run per subbasin
  • Calibrated against gauging-station discharge
  • Future-climate projection of the basin water balance
Published in Water (2023) and Hydrology (2024) Read paper
Peer-reviewed record

The methods are already on the record

Six peer-reviewed papers, more than 200 citations. The methods I use in client work are the same ones that went through review, so you can point to the paper when someone asks how the numbers were produced.

2026
Predicting suitable regions for avocado (Persea americana Mill.) cultivation in Tanzania
Juma, I., Valencia, J. B., & Cortés, A. J.
2024
Predictive assessment of climate change impact on water yield in the Meta River basin, Colombia: an InVEST model application
Valencia, J. B., Guryanov, V. V., Mesa-Diez, J., Diaz, N., Escobar-Carbonari, D., & Gusarov, A. V.
2023
Assessing the effectiveness of the InVEST annual water yield model for the rivers of Colombia: a case study of the Meta River basin
Valencia, J. B., Guryanov, V. V., Mesa-Diez, J., Tapasco, J., & Gusarov, A. V.
Water, 15(8), 1617doi.org/10.3390/w15081617
2020
Climate vulnerability assessment of the Espeletia complex on páramo sky islands in the Northern Andes
Valencia, J. B., Mesa, J., León, J. G., Madriñán, S., & Cortés, A. J.
Front. Ecol. Evol., 8, 565708doi.org/10.3389/fevo.2020.565708
2018
On the causes of rapid diversification in the páramos: isolation by ecology and genomic divergence in Espeletia
Cortés, A. J., Garzón, L. N., Valencia, J. B., & Madriñán, S.
Front. Plant Sci., 9, 1700doi.org/10.3389/fpls.2018.01700
2016
Low emission development strategies in agriculture: an agriculture, forestry, and other land uses (AFOLU) perspective
De Pinto, A., Valencia García, J. B., et al.
Full list on Google Scholar More than 200 citations across Horticulturae, Water, Hydrology, Frontiers, and World Development.
Open notebooks

Methods you can open and run

A few of the notebooks I keep public. They cover the everyday building blocks of spatial and climate analysis, and the client work is documented to the same standard.

GEE · Python · Colab

Spatial data with Google Earth Engine

A Colab walkthrough for pulling, processing, and exporting satellite data through the Earth Engine Python API.

Open notebook
Climate · Python · Bias correction

CHIRPS rainfall, three correction methods

Three methods for correcting CHIRPS satellite rainfall against gauge data, compared side by side, so the rainfall series is sound before anything gets built on it.

Open notebook
Geostatistics · Interpolation

IDW versus Kriging interpolation

A side-by-side comparison of deterministic (IDW) and geostatistical (Kriging) interpolation for turning sparse point measurements into continuous surfaces.

Open notebook
Land cover · Remote sensing

Comparing forest and land-cover sources

A comparison of global forest and land-cover products that shows how the choice of source changes the answer for a given region.

Guest contributor: Fabio Castro-Llanos · Un geógrafo en YouTube
Open notebook
Climate · Reanalysis · Python

NOAA reanalysis data in Python

Working with gridded NOAA climate reanalysis in Python: reading the fields, cutting them to a region, and pulling out the series you actually need.

Open notebook
Land-use change · CA-Markov

Predicting future land use, Caquetá

A CA-Markov model that projects future land use in Caquetá, Colombia, from historical transition rates and a cellular-automata simulation.

Open notebook
Tools

Applications you can use today

Some of the work becomes a tool rather than a report. This one solves a problem that shows up in almost every project: field points that are wrong, duplicated, or sitting in the sea.

Shiny web app · Spatial data cleaning

GIS Data Cleaner

Upload a point dataset, see it on a map, and fix it by hand where automatic rules are not enough. Delete outliers, move misplaced records, edit attributes, and export a clean GIS layer ready for QGIS, ArcGIS, R, or Python. No installation, no login.

  • Upload a CSV, Excel, GeoJSON, or zipped shapefile up to 50 MB
  • Plot every record on an interactive map and inspect it against the terrain
  • Clean by hand: delete, drag, or edit points, a supervised pass that catches what rules miss
  • Download the result as GeoJSON or shapefile, with the attribute table intact
R · ShinyLeafletsfGeoJSON · ShapefileFiles up to 50 MB
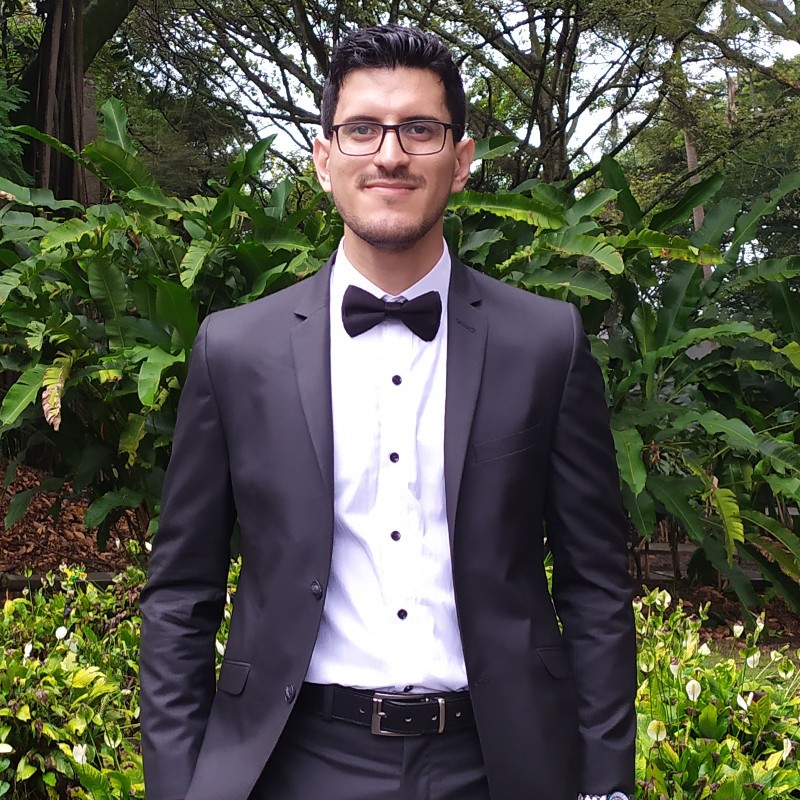
Portrait of Brian Valencia García. BRIAN VALENCIA GARCÍA
About

From field plots to satellite data

I am a Colombian agricultural engineer. The question that has driven my whole career is a simple one: how do we help farmers and ecosystems adapt to a changing climate? Answering it took me from fieldwork to a Master's in hydrometeorology at Kazan Federal University in Russia, and then into geospatial machine learning.

Over twelve years I have worked across the páramos of the Andes, the farming systems of sub-Saharan Africa, and precision agriculture in Australia. I spent three and a half years at CIAT on climate risk assessment, collaborated with Curtin University, and since 2023 I have been with the African Plant Nutrition Institute, where I build spatial frameworks for nutrient stewardship and climate resilience.

I care about reproducibility and outputs people can actually use. Everything I deliver comes with the code, the documentation, and clear methods, so your team can update or extend it later. If a project is a good fit, I will say so plainly, and if it is not, I will tell you that too.

Languages & tools

RPythonGoogle Earth EngineQGISArcGISPostGISsf / terratidymodelsMaxEntInVESTQuartoShinyLeaflet

Languages spoken

SpanishNative
EnglishC1
RussianB2
How it works

Getting started

The first step is just a call. If it looks like a fit, I write up what I would do and what it would cost, and you take it from there.

Scoping call

A short call to go through what you want to know, what spatial data you already have, and whether the project is a good fit for the way I work.

No charge for this conversation

Proposal & scope

If we go ahead, I send a short proposal with the deliverables and a timeline. Some projects are a two-week analysis. Others are multi-month pipelines or an interactive Shiny tool. It depends on the data and on what you need to do with the result.

Delivery & handoff

You receive the spatial models, final maps, a written report, and documented source code, or a working web application if that is what the project needs. Pipelines are built in R, Python, Google Earth Engine, and Quarto, so your team can rerun them when new data arrives.

Work together

Let's talk about your project

Tell me what you are trying to do and what data you already have, and I will come back quickly with a rough approach and what it would take.

Response time: 1–2 business days· Timezone: GMT+1· Remote & international